BALTIMORE (Stockpickr) -- It may be Halloween, but some of the scariest stuff you see today might be in your portfolio.
Must Read: Warren Buffett's Top 10 Dividend Stocks
That's because, in spite of a big bounce session today, there are some stocks that still look "toxic" in this market. The overnight decision by the Bank of Japan to hike its stimulus efforts means that the stock market may be pointing higher as a whole, but it's a bad idea to let your guard down.
Buying big, safe blue chips doesn't make you immune from owning toxic stocks, either. In fact, nearly every stock on our list today is a large-cap that's worth more than $10 billion in market value. These aren't just names to avoid buying because you might already own them today.
Just to be clear, the companies I'm talking about today aren't exactly junk. By that, I mean they're not next up in line at bankruptcy court. But that's frankly irrelevant; from a technical analysis standpoint, sellers are shoving around these toxic stocks right now. For that reason, fundamental investors need to decide how long they're willing to take the pain if they want to hold onto these firms in the weeks and months ahead. And for investors looking to buy one of these positions, it makes sense to wait for more favorable technical conditions (and a lower share price) before piling in.
For the unfamiliar, technical analysis is a way for investors to quantify qualitative factors, such as investor psychology, based on a stock's price action and trends. Once the domain of cloistered trading teams on Wall Street, technicals can help top traders make consistently profitable trades and can aid fundamental investors in better planning their stock execution.
So without further ado, let's take a look at five toxic stocks you should be unloading.
Must Read: 5 Stocks Insiders Love Right Now
Amazon.com
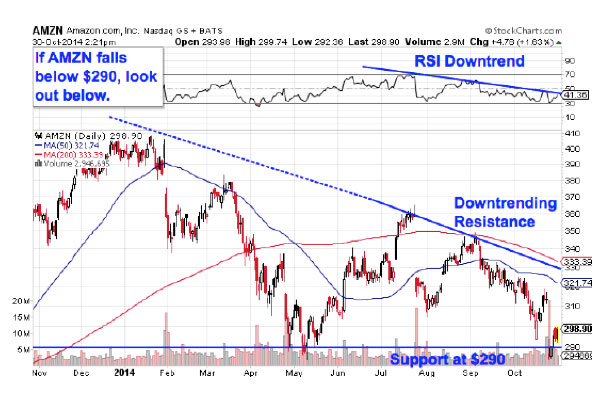
Up first is Amazon.com (AMZN), the $136 billion online retail giant. Amazon has had a pretty awful year in 2014, falling more than 25% since the calendar flipped to January. But that doesn't mean that investors are coming up on a bargain buying opportunity -- just the opposite. AMZN looks ready for a second leg down here.
Amazon is currently forming a descending triangle, a bearish price setup that's formed by horizontal support to the downside at $290 and downtrending resistance above shares. Basically, as AMZN bounces in between those two technically significant price levels, it's getting squeezed closer to that $290 support line. If that level gets broken, then AMZN is open to a lot more downside risk. This is a long-term price setup, and that means it comes with equally long-term trading implications when the breakdown does happen.
Momentum offers some extra confirmation of a downward move: 14-day RSI has been trending lower since this summer, an indication that selling pressure is still mounting in Amazon. Since momentum is a leading indicator of price, AMZN is a name that's best avoided here.
Must Read: 10 Stocks George Soros Is Buying
China Mobile

We're seeing the exact same setup in shares of Chinese cellular giant China Mobile (CHL). Like Amazon, China Mobile is forming a descending triangle setup -- the only difference is that this pattern is forming in the much shorter-term. The sell signal comes on a breakdown through $57 support.
Why all of the significance at $57? It's not magic. Whenever you're looking at any technical price pattern, it's critical to keep buyers and sellers in mind. Patterns like the descending triangle are a good way to quickly describe what's going on in a stock, but they're not the reason it's tradable. Instead, it all comes down to supply and demand for CHL's shares.
That $57 level in China Mobile is the spot where there's previously been an excess of demand for shares; in other words, it's a price where buyers have been more eager to step in and buy shares at a lower price than sellers were to sell. That's what makes a breakdown below support so significant -- the move means that sellers are finally strong enough to absorb all of the excess demand at the at price level. Still, CHL doesn't officially become toxic until $57 gets violated.
Must Read: 5 Big Stocks to Trade for Gains as QE3 Ends
Post Properties

The smallest name on our "toxic" list today is Post Properties (PPS), a mid-cap REIT that's had a spectacular run in 2014. At first glance, Post doesn't look toxic at all. Shares of this $3 billion apartment landlord are up more than 20% this year, and shares are just a dollar shy of 52-week highs as I write. But Post is starting to look "toppy" here, and investors need to be on the lookout for the sell signal in this stock.
PPS is currently forming a double top pattern. The double top looks just like it sounds: It's a bearish reversal trade that's formed by a pair of swing highs that top out at approximately the same price level. The sell signal comes on a violation of the support level that separates the tops, that $50.50 price floor in the case of PPS. If shares break down below that most recent swing low, then we're seeing a major change in trend.
The 200-day moving average has been a good proxy for Post's uptrend in recent months. If that red line gets violated, then it adds some extra fuel to the downside fire in shares. If it happens, it'll slightly lead our $50.50 breakdown.
Must Read: 5 Rocket Stocks to Buy for November Gains
United Technologies

You don't have to be an expert technical trader to figure out what's going on in shares of United Technologies (UTX). The setup in this $97 billion industrial name is about as simple as it gets. Shares of UTX have been bouncing their way lower in a well-defined downtrend, bouncing in between a pair of parallel trend lines that have marked the high-probability range for shares to stay within.
Those four previous tests of resistance have provided pretty predictable selling opportunities for shares of UTX all the way down. If you're looking for a chance to get out on test number five, it makes sense to wait for the next bounce lower before you sell.
Waiting for that bounce lower before clicking "sell" is a critical part of risk management for two big reasons: It's the spot where prices are the highest within the channel, and alternatively it's the spot where you'll get the first indication that the downtrend is ending. Remember, all trend lines do eventually break, but by actually waiting for the bounce to happen first, you're confirming that sellers are still in control before you unload shares of UTX.
Relative strength adds another red flag to the setup in United Technologies. This stock's relative strength line has been in a downtrend since April, an indication that UTX has been underperforming the S&P over that stretch. As long as the downtrend in relative strength remains intact, UTX's underperformance should continue.
Must Read: 4 Stocks Under $10 Triggering Breakout Trades
Nokia

Last up is Finnish handset maker Nokia (NOK). Despite a nearly 25% move higher since the beginning of February, NOK's price action is starting to show some cracks thanks to a classic technical setup that's been forming for the last several months. Here's how to trade it.
NOK is currently forming a head and shoulders top, a setup that indicates exhaustion among buyers. The pattern is formed by two swing highs that top out at approximately the same level (the shoulders), separated by a higher high (the head). The sell signal comes on a move through Nokia's neckline at $7.70. For now, the uptrend from February's lows is still intact. If that dashed line gets violated, it's going to lead the breakdown below our $7.70 neckline level. Consider that an early warning sign.
Lest you think that the head and shoulders is too well-known to be worth trading, the research suggests otherwise. A recent academic study conducted by the Federal Reserve Board of New York found that the results of 10,000 computer-simulated head-and-shoulders trades resulted in "profits [that] would have been both statistically and economically significant."
That's good reason to keep an eye on NOK's $7.70 breakdown level this week.
To see this week's trades in action, check out the Toxic Stocks portfolio on Stockpickr.
-- Written by Jonas Elmerraji in Baltimore.
Must Read: 10 Stocks Billionaire John Paulson Loves in 2014
Follow Stockpickr on Twitter and become a fan on Facebook.
At the time of publication, author had no positions in stocks mentioned.
Jonas Elmerraji, CMT, is a senior market analyst at Agora Financial in Baltimore and a contributor to
TheStreet. Before that, he managed a portfolio of stocks for an investment advisory returned 15% in 2008. He has been featured in Forbes , Investor's Business Daily, and on CNBC.com. Jonas holds a degree in financial economics from UMBC and the Chartered Market Technician designation.Follow Jonas on Twitter @JonasElmerraji
No comments:
Post a Comment